As the technological evolution in independent schools continues at a fast pace, so does the need for effective technology leaders, whose compensation must be in line with the essential work they deliver. So, once again, ATLIS partnered with Ed Tech Recruiting to conduct an extensive analysis to bring forth key findings on the state of compensation of such leaders. In this fifth annual report, which highlights some new vital metrics, the 2024 Compensation Benchmark Report for Technology Leaders in Schools serves to offer a thorough evaluation on the value of the role of these leaders in independent schools.
“This year we added satisfaction measures to provide schools with additional context around the data we’ve provided in the past,” said Christina Lewellen, MBA, CAE, executive director of ATLIS. “It remains a valuable exercise to benchmark technology teams’ compensation, but doing so in the context of broader satisfaction measures may help schools identify areas of potential risk on the hiring and retention front. We don’t want schools to be caught off guard with a preventable staffing issue given how swiftly things are moving with technology, including AI, cyber risk, and student data privacy. We hope this data provides a starting point for meaningful conversations around compensation, benefits, and job satisfaction for what has become a lynchpin position in our schools.”
The additional satisfaction measures from this year’s survey are key to painting a broader picture beyond compensation, and while most survey respondents are satisfied with their roles, some areas of concern may need improvement. As for compensation, technology leaders are seeing a well-deserved salary uptick overall, but certain groups are still falling short of where they should be compared with their peers. The benefits side is also somewhat concerning, with much of the 2023 data showing a downward trend compared with 2022. To gain a deeper understanding of the survey results, here are a few key findings from this latest ATLIS study, starting with those new satisfaction measures.
Key Finding: Satisfaction Generally Solid
For the first time, survey participants were asked to gauge their job satisfaction in several areas, including work environment, salary, benefits, career advancement, and work-life balance. The results were tallied based on whether technology leaders were not satisfied or either “somewhat satisfied” or “highly satisfied;” the survey did not include a neutral option. The results were then identified with an excellence rating based on those responses.
Overall job satisfaction garnered the highest excellence rating at 92%, followed by work environment satisfaction (89%), benefits satisfaction (87%), areas of responsibilities satisfaction (87%), and career advancement satisfaction (86%).
NEEDS IMPROVEMENT
Although the aforementioned areas are all extremely important and the results encouragingly positive, the numbers drop off considerably in the following areas: salary satisfaction (79%), work-life balance satisfaction (77%), professional development satisfaction (62%), and flexibility satisfaction (53%). (See Figure 1.)
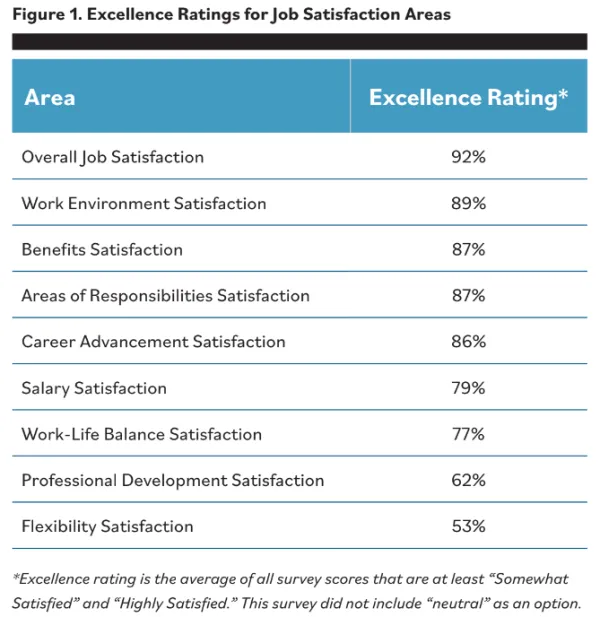
The bottom two areas — professional development satisfaction and flexibility satisfaction — may be cause for concern. Only 50% of respondents have guaranteed access to professional development funds, and just more than half feel they have the flexibility they need to execute their roles. These findings align with the ongoing need for more technology leaders to have consistent professional development opportunities and, in some cases, that essential seat at the administrative table (more on that later).
Key Finding: Average Salary on the Rise
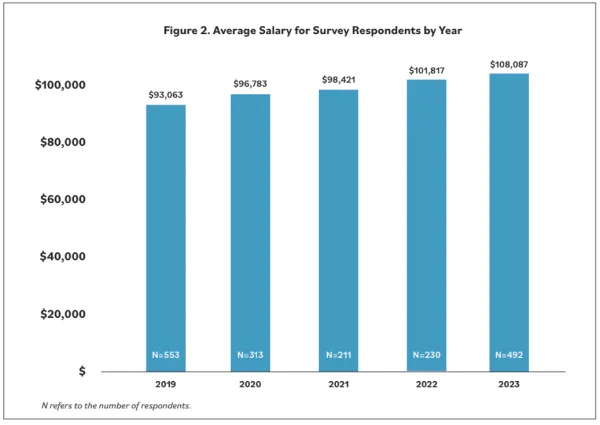
Technology directors’ average salary increased more than 6% from 2022 to 2023, a finding that marks the largest jump in survey participants’ salaries since ATLIS’s first benchmarking report in 2019. (See Figure 2.)
DEMOGRAPHIC DISPARITIES
Although salaries have increased overall year over year, the numbers could be slightly misleading, especially when considering the region in which technology leaders work and the leaders’ genders and ethnicities.
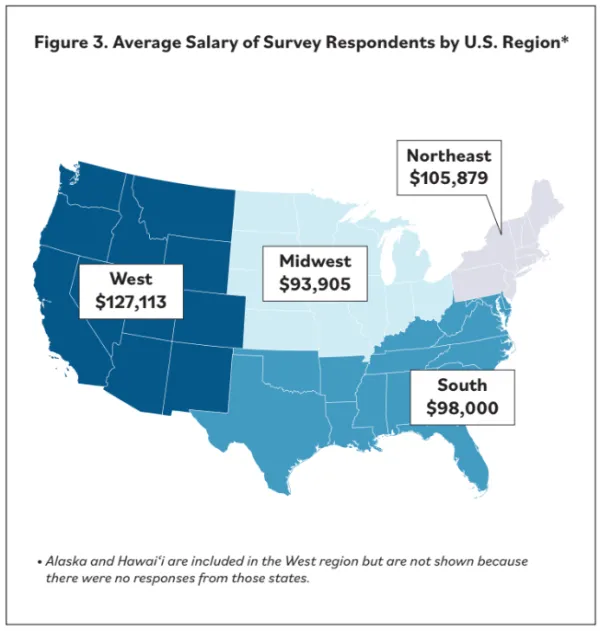
The Midwest region, for example, experienced a 1.2% decline in average salary in 2023, on top of a 13% decline in 2022. And the South, although seeing a 16.2% increase in 2023, is still well below the overall average of $108,087, with an average salary of just $98,000.
In contrast, the West saw an average salary of $127,113, which certainly bumps the overall average up considerably. (See Figure 3.)
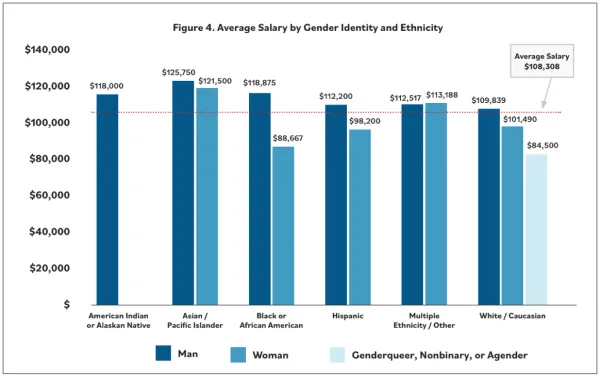
Another caveat in the average salary findings is that some demographic subsets of survey participants saw much lower average salaries, including Black or African American women (just over $88,000), white nonbinary individuals ($84,500), and Hispanic women ($98,200).
Although not always the case in past editions of the report, participants who identify as men did report above-average salaries in all ethnic subcategories for 2023. (See Figure 4.)
Key Finding: That Seat at the Table
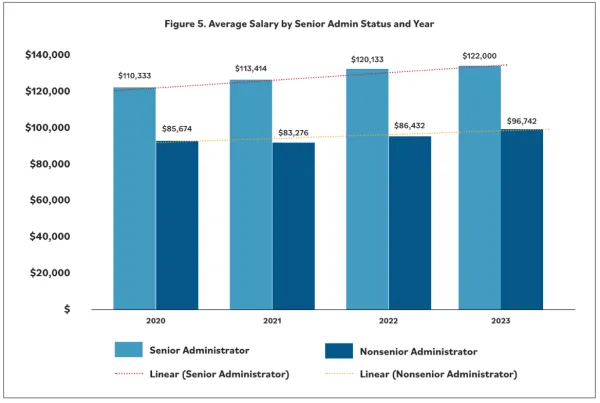
Another correlation with salary is administrative status. While an encouraging rise exists among both senior administrators and nonsenior administrators, particularly the latter, the gap remains at around $25,000 in average salary.
That gap did close from around $34,000 from 2022, but the issue remains that being a senior administrator is key to not only having an essential voice but also a salary commensurate to the arduous work done by technology leaders, regardless of status. (See Figure 5.)
WHO HAS THE SEATS
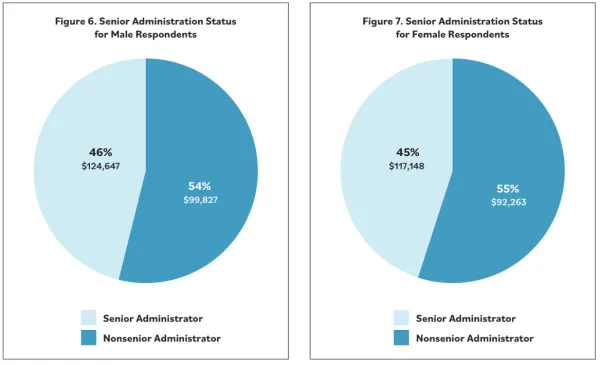
Looking at male respondents versus female respondents, 46% and 45%, respectively, held senior administrator roles. Last year’s findings, based on 2022 data, saw a pay disparity between men and women at $25,000. This year, that gap has narrowed to a difference of about $7,500. So, beyond women achieving senior administration status at around the same percentage as men, the salary differential is closing, too.
It’s also worth noting that among nonbinary, agender, and genderqueer respondents — albeit a very small sample — half indicated senior administration status. The average salary of those individuals was just $92,000. ATLIS will continue to keep an eye on this number in future reports to identify whether the disparity between this group and other genders is changing. (See Figures 6 and 7.)
Key Finding: Benefits and Turnover
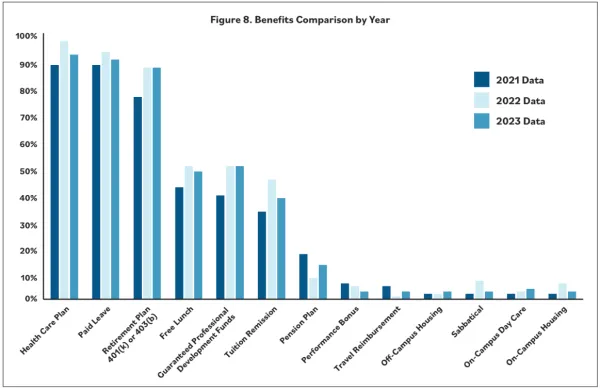
Benefits packages improved in almost every facet for technology leaders from 2021 to 2022. Unfortunately, the same cannot be said going from 2022 to 2023. This year’s report showed a softening in the packages being offered to technology leaders.
Two areas that improved were pension plans and travel reimbursement, which actually dropped in 2022 and remain below their 2021 marks. The only two areas that rose in 2023 without having fallen in 2022 were on-campus day care and off-campus housing offerings.
CAUSE FOR CONCERN
Given the competitive hiring marketplace and high turnover at some independent schools, the softening of benefits packages raises a red flag. Pair those factors with the 48% of survey respondents who said they are “somewhat likely” or “highly likely” to search for a new job in the next two years, and schools and their hiring teams might find themselves behind the eight ball moving forward. So, to retain existing technology leaders, attract replacements when turnover hits, and attain or maintain the utmost value in the talent realm, schools may be wise to shore up their benefits packages in 2024. (See Figure 8.)
Looking Back in Order to Look Forward
As the only association representing technology teams serving independent schools, ATLIS releases all of the survey’s findings in its 2024 Compensation Benchmark Report for Technology Leaders in Schools to help schools attract and retain the technology professionals needed to meet their missions. The historical context provides valuable perspective and a starting point for conversations around meeting schools’ technology needs in the future.
“Independent school administrators are committed to attracting and retaining the best technology talent for their communities, and having accurate and relevant compensation data can be a powerful tool when considering some of the challenges of today’s marketplace,” Lewellen said. “At a time in which the intersection of technology, communication, diversity, and leadership is more vital than ever, it’s absolutely essential that this community continues to have meaningful, proactive conversations around their compensation strategies for technology teams.”
