
To help technology leaders understand where they fit in the broad and ever-evolving independent school landscape, it remains essential that tech leaders have what they need to start the necessary conversations surrounding compensation and growth. As in years past, ATLIS partnered with 12M & Ed Tech Recruiting to conduct an extensive analysis to bring forth important, relevant findings in role-related compensation. Now in its sixth year of publication, the 2025 Compensation Benchmark Report for Technology Leaders in Schools yet again serves as that vital benchmarking resource.
Leaders on the Move
One finding in this year’s report especially stood out: 43% of respondents are “somewhat” or “highly likely” to search for a new job within the next two years. According to the report, a few factors that likely play into a tech leader’s desire to move on or stay stand out. Those are job satisfaction and flexibility, which tend to be related. It’s clear that institutions that focus on flexibility are more likely to improve employee job satisfaction. Of course, salary also plays into that equation significantly.
The good news, despite a high number of respondents looking to move to a new job, is that 83% of respondents are “somewhat” or “highly satisfied” with their jobs overall. On top of that, 79% are satisfied with their work environment and the areas of responsibilities in their roles. The biggest drawback is a lack of flexibility, followed by career advancement opportunities; only 41% of respondents noted they are “somewhat” or “highly satisfied” in those areas.
Job Satisfaction Correlation
As the benchmarking report notes, tech leaders are more likely to report being satisfied with their jobs if they are content with their responsibilities and the environment in which they work.
Another key factor in job satisfaction is having a favorable work-life balance, followed less convincingly by opportunities for career advancement and professional development, adequate salary, role flexibility, and solid benefits.
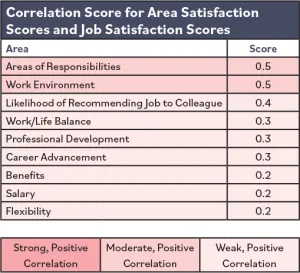
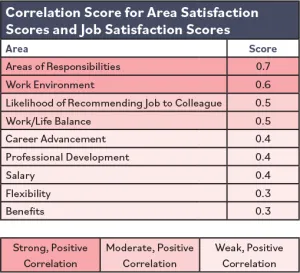
A standout finding is that almost all factors showed a stronger correlation to job satisfaction in last year’s report compared to this year’s. That related drop in overall satisfaction is a trend certainly worth watching over future editions of the report.
Searching for a new job has its obstacles, including finding the right fit for skills and career path, geographical limitations, the inability to pursue a new job without a current employer finding out, perceived employer bias, and other issues.
“Because tech leaders are considering moving to new schools at such a high level, the independent school community must have the resources it needs to make that happen — not only to ensure our tech leaders can continue their careers with upward mobility but also because our schools need skilled, experienced, and thoughtful tech leaders to usher them into the future,” said Christina Lewellen, MBA, CAE, president and CEO of ATLIS. “That’s one reason the Technology Leaders in Independent Schools (TLIS) certification exists. We created this to help tech leaders to refine their skills, develop those they have yet to master, and come out the other side with a real credential that shows schools they have everything it takes to lead tech transformation.”
Beyond a clear need to support tech leaders as they aim to reach new heights in their careers, ATLIS highlights several other key findings in the report. Here are a few that are essential to communicate to the independent school community:
Most Salary Averages Dipped Slightly
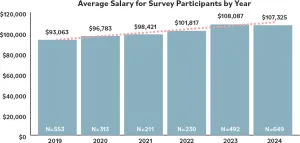
Another perhaps surprising finding: For the first time since this report’s inception in 2019, average salary saw a decrease. Now, that decrease was just 0.7%, and after last year’s significant jump from an average salary of $101,817 to $108,087 — the largest jump in the report’s history — an overall upward trend remains over the past six years. The overall increase in average salary from 2019 to 2024 is an encouraging 15%.
Senior Leadership, Gender, and Ethnicity
Much like overall average salary, the average salary for non-senior administrators dropped ever so slightly in this year’s report, as opposed to a nearly 4% increase for senior administrators. Despite that disparity, senior and non-senior administrators continue an upward trend in average salary over the past four years. Over that period, senior administrator salaries have increased 11.2%, and non-senior administrator salaries have risen 15%.
Looking back to data from 2022, male senior administrators made, on average, $25,000 more than female senior administrators. Since then, that gap has shrunk to a difference of $7,500 and $7,770 in 2023 and 2024, respectively. Additionally, women are attaining senior administration status at approximately the same percentage as men — 45% for women versus 46% for men — showing, like other data explored to this point, a general upward trend for women in status and salary. One more quick boon to the female side of the equation: Women who have served 31-plus years at their institutions outearned their male counterparts by 14%.
Despite a small sample for nonbinary, agender, and genderqueer respondents, half of these respondents in this year’s report indicated senior administrator status. (Note: All respondents in this gender subcategory identified as white/Caucasian.) ATLIS remains committed to reporting trends for this gender subcategory and will continue to track this data across a broad spectrum moving forward.
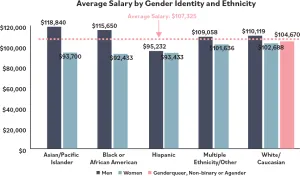
Moving on to the intersection of gender and race and ethnicity, although the average salary across the board was more than $107,000 and the overall disparity between men and women has tightened over the years, some ethnic subsets are averaging much lower average salaries. According to the report, Black or African American women have an average salary of $92,400, compared with an average salary of $115,650 for Black or African American men. Similarly, Asian or Pacific Islander women reported an average salary of $93,700, compared with $119,000 for Asian or Pacific Islander men. Both Hispanic men and women fell below the average salary, coming in at $95,232 and $93,433, respectively.
Geographical Variation
Of course, the region in which tech leaders work also factors into average salary. ATLIS divides the U.S. into four regions, each comprising the following states:
- Northeast: Connecticut, Maine, Massachusetts, New Hampshire, New Jersey, New York, Pennsylvania, Rhode Island, and Vermont.
- South: Alabama, Arkansas, Delaware, Florida, Georgia, Kentucky, Louisiana, Maryland, Mississippi, North Carolina, Oklahoma, South Carolina, Tennessee, Texas, Virginia, and West Virginia.
- Midwest: Illinois, Indiana, Iowa, Kansas, Michigan, Minnesota, Missouri, Nebraska, North Dakota, Ohio, South Dakota, and Wisconsin.
- West: Alaska, Arizona, California, Colorado, Hawai‘i, Idaho, Montana, New Mexico, Nevada, Oregon, Utah, Washington, and Wyoming. (Note: The survey garnered no responses from Alaska or Hawai‘i.)
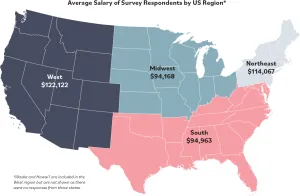
Like in 2024, the West boasted the largest average salary of $122,122. The Northeast came in next at $114,067. The South followed at $94,963, just slightly ahead of the Midwest at $94,168. Some year-over-year data to keep in mind: First, after a 13% decline in average Midwest salaries in 2022 and 1.2% decline in 2023, the region saw a 0.3% increase in 2024 — an encouraging sign of stabilization. Second, after a huge 16% jump in average salaries in the South in 2023, the region saw a 3% decline in 2024. Third, the West saw a 4% decrease in average salaries in 2024. Lastly, the Northeast experienced a positive boost of 8%. ATLIS will keep an eye on these “pendulum swings,” as the association calls them in the report, in future data sets.
One final note not to be ignored: The average salary for international respondents, of which there were 13, was $100,671 in 2024, a 4% increase from 2023.
Looking Forward
ATLIS is committed to collecting, evaluating, and communicating essential data surrounding ed tech roles and compensation across the independent school landscape. The association’s goal is to provide real, useful insights that can be used to move the needle in the right direction and create a stronger future for tech leaders around the world. ATLIS even launched, with a little help from Mission & Data, an interactive dashboard based on its annual data (see sidebar to the right).
“ATLIS is here to be as helpful as humanly possible for all the tech leaders — and thus, the schools — we serve,” Lewellen said. “By delivering this essential data to both members and nonmembers, we aim to keep the future of independent schools in strong hands. Add to that the interactive dashboard and all the other resources we provide throughout each year, [and] tech leaders — and again, their schools — can rest assured we have their backs and will continue to for decades to come.”

